This project is focused on the analysis and visualisation of performance of a social media advertising campaign. This dataset was gotten from Kaggle. The dataset is modelled to mirror a real-world scenarios on platforms like Facebook and Instagram.
The datasets is a relational database modelled in four tables, and are all in comma separated values (CSV).
This project was achieved using only two tools (Python and Power BI).
Project Aim
The aim of this project is to derive insights by:
- finding patterns in engagements, clicks, impressions, target audience,
- determine which ad platform generates the best performance,
- compare different different ad types across different campaigns
- Evaluate the overall performance of social media campaigns in terms of impressions, clicks, and engagement rates.
- Assess the effectiveness of campaigns across platforms, ad types, and target demographics.
- Measure targeting accuracy by comparing engagement from intended versus unintended audiences.
- Analyze temporal and geographic patterns to identify peak engagement times and high-performing regions.
- Examine budget efficiency and ROI metrics such as CPC and CPM to optimize campaign spending.
- Provide actionable insights through a comprehensive Power BI dashboard to inform future campaign strategies.
Power BI Dashboard Report
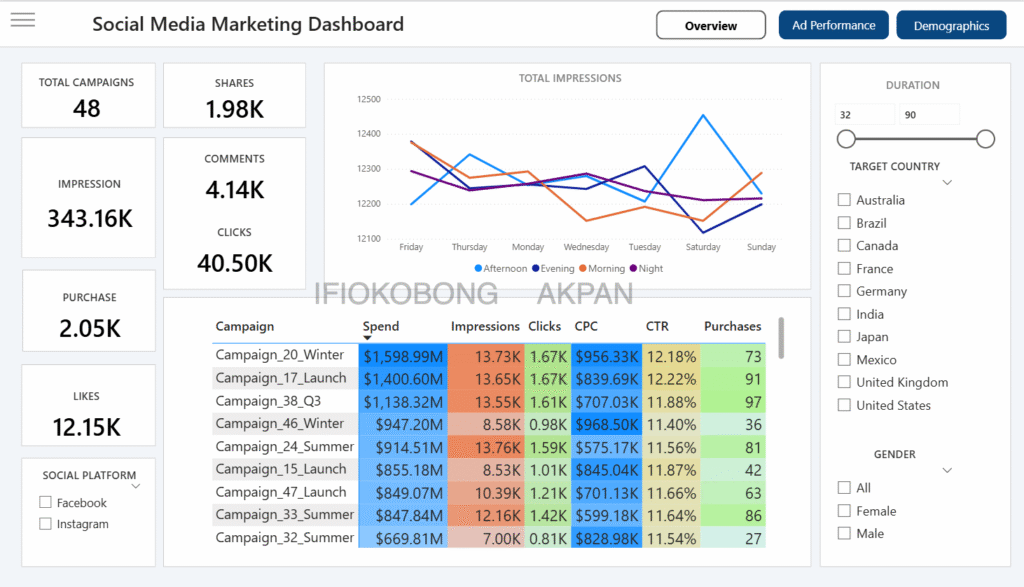
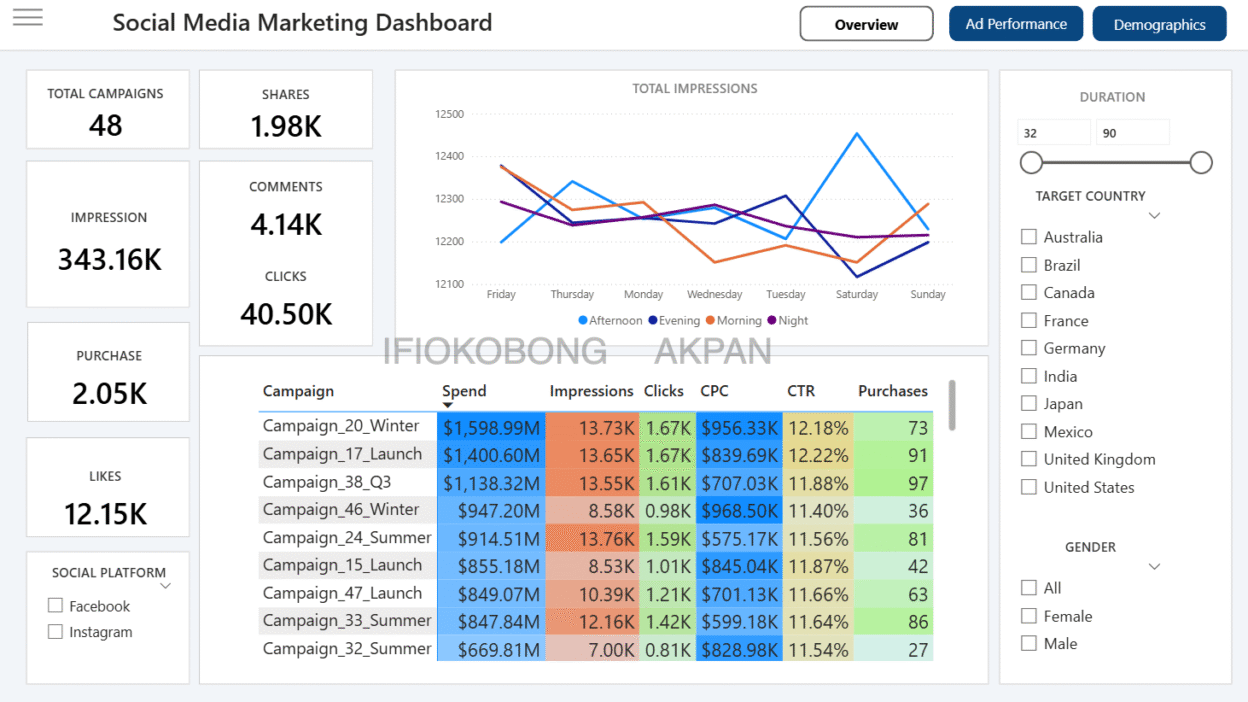
The analysis shows that there are 48 unique campaigns active on Facebook and Instagram platform, with a 32-90 day duration range, with 200 ads. The dashboard reports a total of 343.1K impressions, 1.98K shares, 4.14K comments, 40.5K clicks, 2.05K purchases, and 12.15K likes.
Impressions chart shows daily trends across morning, afternoon, evening, and night, with peaks on Saturday. The campaign targeted 10 countries, with content tailored to male, female, and/or all gender audiences.
I also observed that the campaign which resulted to the highest number of purchases (97) was Campaign_38_Q3, with Click Through Rate (CTR) of 11.88%, 13.55k impression.
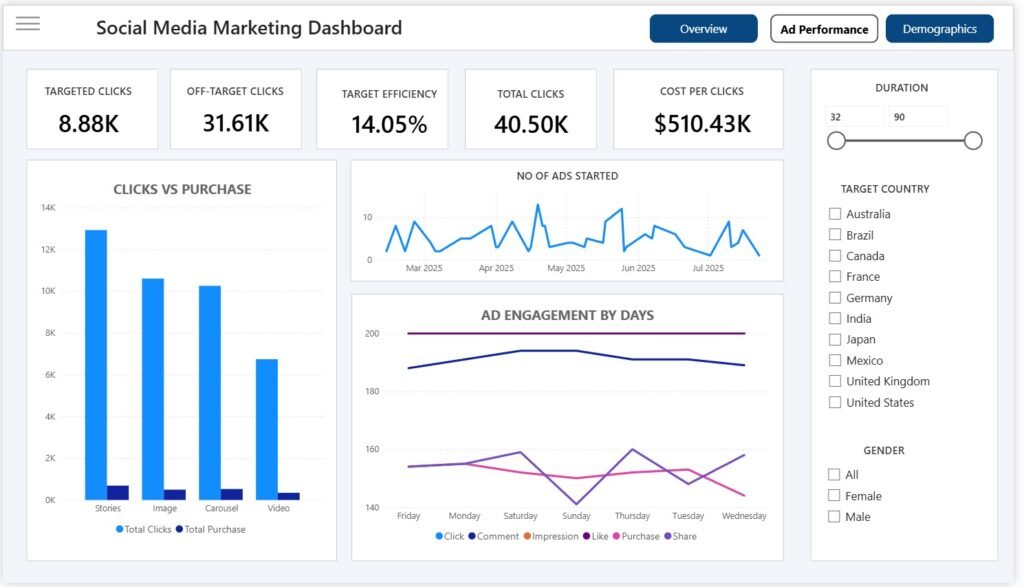
Ad engagement by day of the week shows interesting patterns: Likes and Impressions remain high and steady. Comments and Shares are more volatile, peaking on weekends. Purchases stay relatively stable around 200 per day, regardless of the day.
Ad and Demographic Performance
Looking beyond campaigns to ad types and audience targeting provides a sharper picture of engagement quality. Out of 40.50K clicks, only 8.88K were targeted, resulting in a target efficiency of 14.05%. This indicates significant ad spend is being lost to off-target audiences. Total spend on clicks reached $510.43K, underscoring the need for better targeting to improve ROI.
Looking deeper at clicks by age group across ad types: 35–44 and 18–24 year old account for the bulk of ad clicks. Ads resonate far less with older audiences (45+), which suggests campaigns targeting them may not yield strong ROI.
From this demographic breakdown, one message is clear: Facebook Stories aimed at women aged 18–34 deliver the best engagement and conversion potential. While Instagram contributes, it lags behind Facebook in both volume and effectiveness. Video ads continue to underperform, signaling the need to either refine video strategy or reallocate budget toward Stories and Images.
Audience of ages between 18–24 year old are the most active, especially on Facebook, where clicks exceed 400. 35–44 year old follow closely, engaging well on both Facebook and Instagram. 25–34 year old show moderate but steady engagement across both platforms. Older age groups (45–54, 55–65) contribute minimally.
This means that Millennials and younger Gen Z (18–34) remain the sweet spot for ad targeting.